Contents
- Introduction
-
Body
- Functional structure of PPARγ
- PPARγ mechanism of action in food intake and energy metabolism
- Background of ROS role in ARC energy metabolism and food intake
- Peroxisome proliferation-related ROS in ARC food-intake regulation
- Obesity and metabolic disorder therapies related to PPARγ
- PPARγ activity in inflammatory processes
- PPARγ crosstalk with Vitamin D Receptor system
- Conclusion
- References
Role of peroxisome proliferator-activated receptors (PPAR) in the regulation of food-intake regulating hypothalamic (AgRP, POMC) cells
Introduction
Within the manifold processes of metabolism, a multifaceted member of the nuclear receptor superfamily: peroxisome proliferator-activating receptor (PPAR) has been discovered as an integral mechanistic component of energy balance. (Varga et al 2011) The PPAR protein family has three subtypes, namely PPARα, PPARβ/δ and PPARγ. (Tyagi et al 2015) Subtypes α, β/δ, γ are named so due to their chronological identification in Xenopus and following other vertebrate species. (Varga et al 2011) Here, PPARγ will be held in primary focus both because of the significantly larger mass of publication dealing with this subtype versus the other two and more importantly because of particular experiments implicating PPARγ in higher order food-intake regulation and lipid metabolism. Such higher order integration of metabolism resides primarily in the arcuate nucleus (ARC) of the hypothalamus. The essential proximity of the ARC to both capillary blood and ventricular CSF allows the neuronal groups with food-intake regulatory functions, namely POMC/CART and AgRP/NPY neurons to have first line access to the vital status of the body and brain. The proposed ligands of PPARγ are small molecules, namely fatty acids, eicosanoids, LDLs, oxidized alkyl phospholipids and nitrolinoleic acid. (Lehrke and Lazar 2005) These small molecules are able to influence transcriptional activity of a wide variety of genes which contain peroxisome proliferator response element (PPRE) sequences. (Chandra et al 2008) Recent discoveries of PPARγ’s role in molecular mechanisms of metabolism are interlinked with oxidative status; as PPAR’s name suggests it is directly involved in peroxisome proliferation. Peroxisomes have an essential function in non-ATP generating lipid beta oxidation and control of ROS. (Diano et al 2012) At the crossroads of food intake, lipid metabolism and energy status integration, PPARγ is involved in multiple layers of physiological functionality which becomes particularly apparent in disease; PPARγ is implicated in a vast majority of the diseases/disorders plaguing the western world, namely obesity, atherosclerosis, cancer and neurodegenerative disease.
|
|
Body
Functional structure of PPARγ
- PPARs are a particularly unique family of nuclear receptors; unlike most nuclear receptors, which bind ligands in a highly specific manner at a high affinity, PPARs seemingly bind a multitude of ligands at a low affinity. (Varga et al 2011) This promiscuity of binding is likely due to the relatively large size of the PPAR ligand binding pocket or ligand binding domain (LBD). (Varga et al 2011) PPARγ pairs up with another similarly promiscuous nuclear receptor: retinoid X receptor α (RXRα). (Chandra et al 2008) After PPARγ is bound by a ligand on the nuclear membrane surface, it travels into the nucleus to bind DNA as a heterodimer with RXRα. (Varga et al 2011) The integral structure of both PPARγ and RXRα allow a wide variety of ligands to bind to these proteins. (Chandra et al 2008) Despite the flexible binding character of its LBD, PPARγ has a highly conserved and stable DNA binding domain (DBD). (Chandra et al 2008) The sequence to which PPARγ binds is termed the PPAR response element (PPRE). The PPRE sequence is a repeat of the six nucleotide sequence: AGGTCANAGGTCA, two PPRE sequences are shown here with N representing any single nucleotide between them. (Varga et al 2011) PPARγ-RXR heterodimer forms a multiprotein complex of coactivators or corepressors to act in a direct manner on transcriptional activity of a gene. (Lehrke and Lazar 2005) However, PPARγ can act in an indirect way as well, it may have a histone modifying action of epigenetic relevance or even repress a gene without binding a ligand, see Figure 4. (Lehrke and Lazar 2005)
|
|
PPARγ mechanism of action in food intake and energy metabolism
- PPARγ is a master regulator of fat formation. (Lehrke and Lazar 2005) As an activator of both fatty acid synthesis and storage, PPARγ plays an apparent role in fat metabolism through its canonical transcription modifying activity. (Varga et al 2011) PPARγ has a wide range of non-canonical or alternative transcription modifying activity as well (see Figure 4). Signaling molecules which bind PPARγ, may also activate potentially coexpressed alternate PPAR subtypes (PPARα or PPARβ/δ) due to the PPAR family’s low degree of binding specificity. (Varga et al 2011) As PPARs are not specific receptors for one fatty acid derived molecule, it has been proposed that PPARs are sensor molecules of the mixture of intracellular mixture of available fatty acid species. (Varga et al 2011) Glucose metabolism is also touched mechanistically by PPARs. (Drougard et al 2015) PPARs are key players in the biochemical balance between the distinct and competitive processes of β-oxidation and glycolysis. (Drougard et al 2015) Interestingly, the PPAR subtypes have divergent metabolic roles but overlapping anti-inflammatory effects. (Varga et al 2011) In a recent study by Garretson et al. 2015, AgRP and NPY mRNA levels where correlated with PPARγ activity in ARC. C57BL/6 mice model as well as Siberian hamster model was studied; interestingly, the hamster model is supported as a better model for human appetitive feeding through food hoarding behavior. Intraperitoneal and stereotaxic intraventricular injection induced PPARγ activity was quantified through recording of mRNA levels. GW9662, a selective synthetic PPARγ agonist, as well as rosiglitazone, an FDA approved thiazolidinedione (TZD) drug used in type 2 diabetes (T2D) therapy, where used to test PPARγ action on AgRP and NPY levels in food deprived hamsters and mice with particular attention to overeating when refed. PPARγ modulation resulted in AgRP/NPY neuron excitation in a feedforward manner. PPARγ agonism was shown to increase PPARγ mRNA as well as AgRP and NPY mRNA levels while antagonism decreased PPARγ mRNA levels in AgRP/NPY neurons. In stimulating food intake behavior after food deprivation, PPARγ was shown to exhibit a direct positive effect on AgRP neuron activity. In a broader sense, PPARγ acted to generate positive energy balance while simultaneously decreasing energy expenditure, seen through decreased levels of hamster/mouse-wheel revolutions. Interestingly, plasma ghrelin levels did not significantly change during treatment indicating that PPARγ activity in AgRP/NPY neurons is a ghrelin independent pathway. This observation adds a new mechanism to higher order integration of food intake and energy metabolism. (Garretson et al 2015)
Background of ROS role in ARC energy metabolism and food intake
- Accumulating evidence underlies the significance of reactive oxygen species (ROS) as a vital component of cellular functioning. As such, ROS is also implicated in the pathogenesis of a growing number of diseases. The complex energy balance integration system of the hypothalamus intimately involves reactive oxygen species (ROS) as a form of signaling. (Drougard et al 2015) As peroxisomes are essentially related to intracellular oxidative status so PPARγ is notably involved in the ROS dependent processes of energy metabolism and food intake within ARC neurons. Generally, decreased ROS levels activate AgRP/NPY neurons while increased ROS levels activate POMC neurons. (Drougard et al 2015) AgRP/NPY neurons primarily rely on glucose as fuel while POMC neurons rely on fatty acids (FA) as primary fuel. (Drougard et al 2015) AgRP/NPY neurons are thereby considered glucose excited while POMC neurons are reciprocally glucose inhibited. (Drougard et al 2015) This variable fuel utilization brings forth the competitive biochemical pathways of β-oxidation and glycolysis. (Drougard et al 2015) This internal balance connects ROS levels with the intracellular metabolism of ARC neurons as PPARγ is directly implicated in ROS dependent molecular signaling. (Drougard et al 2015)
Peroxisome proliferation-related ROS in ARC food-intake regulation
- According to recent findings by Diano et al 2012, PPARγ was found to influence POMC and AgRP/NPY neuron activity associated to high fat diet induced obesity. Through the action of PPARγ, as an intracellular controller of ROS levels, the number of peroxisomes in POMC and AgRP neurons where found to be increased. Differential effect of increased ROS levels where noted as POMC neuronal activity decreased and AgRP neuronal activity was promoted along with feeding. Leptin resistance still remains a neurobiological enigma closely linked to disorders of food intake regulation. The present study demonstrates an intriguing link between PPARγ activity through ROS levels and leptin signaling. Leptin levels positively correlated with ROS levels in POMC neurons in lean and transgenic obese (ob/ob) mice while in diet induced obese (DIO) mice this relationship was markedly diminished. (Diano et al 2012) These findings present endogenous ROS control as a possible cause for functional leptin resistance. (Diano et al 2012) PPARγ seems to play a pivotal role in hypothalamic metabolic control physiologically and in pathological states such as DIO and the process of leptin resistance which has recently emerged as a central component to metabolic disease and the pathogenesis of obesity. (Diano et al 2012)
Obesity and metabolic disorder therapies related to PPARγ
- Thiazolidinedione (TZD) was developed as a treatment for type 2 diabetes (T2D) initially without precise knowledge of its molecular activity as a high-affinity agonist of PPARγ. (Lehrke and Lazar 2005) PPARγ agonists such as TZDs despite significantly improving insulin resistance have significant drawbacks through side effects which range from weight gain to oncogenesis. More recently developed therapies target PPARγ through selective modulation. (Lehrke and Lazar 2005) Such modulation may be seen through the activity of partial PPARγ agonists which effect coactivator binding without phosphorylation of PPARγ; in relation to insulin sensitivity treatment this allows for prompt efficacy without the side effect of weight gain. (Lehrke and Lazar 2005) In future development of PPARγ-based therapies the energetic status of the patient will be of significant consideration as PPARγ shows notably different activity in diseased versus healthy individuals. (Merchan et al 2016) PPARγ activation notably improves metabolic parameters in diseased individuals while in individuals with a healthy energetic status its downregulation promotes antiobesity effects. (Merchan et al 2016)
PPARγ activity in inflammatory processes
- PPARγ’s ability to detect fatty acid derived signal molecules and also directly influence the transcription of pertinent lipid metabolism affecting genes place it in a privileged place to in turn take part in molecular mechanisms underlying lipid mediated inflammatory signal cascades. (Varga et al 2011) PPARγ may influence inflammatory pathways through its multiple transcription actions (see Figure 4) by altering lipid metabolism, see Figure 4-E, PPARγ may in turn influences inflammatory processes. Unraveling PPARγ’s complex role in food intake as well as inflammation is a worthy endeavor as obesity and metabolic syndrome integrally involve chronic inflammatory processes. PPARγ is activated in a well fed state and regulates the synthesis of fatty acids and related lipids. (Varga et al 2011) On the contrary, PPARγ is also activated in a state of food deprivation and acts in AgRP/NPY neurons to stimulate food hoarding and food intake in a ghrelin independent pathway, as described above. (Garretson et al 2015) Beyond such multifaceted metabolic action, PPARγ is also shown to have a lipid-independent anti-inflammatory capacity through influencing the expression of various inflammatory proteins in macrophages. (Lehrke and Lazar 2005) ARC energetic integration is directly affected in turn by systemic inflammatory status. Thus, peripheral signals may significantly affect central regulation of food intake in a closed loop feedback system.
PPARγ crosstalk with Vitamin D Receptor system
- A reciprocal communication has recently been observed between pathways of PPAR and vitamin D receptor (VDR) systems. (Merchan et al 2016) VDR, as a nuclear receptor itself, also binds RXR forming a heterodimer which binds DNA in a cooperative manner. (Orlov et al 2012) Dynamically,VDR has a very similar functional association to RXRα as does PPARγ. Besides the functional link between PPARγ and VDR through common RXRα binding, PPARγ has been found to directly bind VDR and inhibit its transactivation. (Merchan et al 2016) A disrupted VDR system results in loss of fat deposits and a great increase of energy expenditure. (Merchan et al 2016) Additionally, vitamin D deficiency is a risk factor in obesity but in nonpregnant adults an obese state seems to be protective of bone density. (Sen 2017) As an additional point of interest, a recent study has found that in breastfeeding dyads, maternal obesity is associated with lower maternal and infant serum vitamin D concentrations which may have a significant impact on infant bone density. (Sen 2017) PPARγ and VDR seem to work in a complex parallel metabolic homeostasis which may break down under different energetic conditions, see Figure 5. (Merchan et al 2016) There are no publications as of yet looking at the VDR-RXRα-PPARγ parallel pathway system in AgRP and POMC neurons. Interestingly however, VDR has recently been implicated in glucose homeostasis and weight regulation in hypothalamic nuclei. (Sisley 2016) The paraventricular nucleus (PVN) was found to be implicated in glucose regulation related VDR action while energy homeostasis was implicated by POMC activity correlated with VDR activity in the arcuate nucleus. (Sisley 2016) Regarding higher order integration of food intake and energy metabolism, parallel VDR and PPARγ systems are of particular interest as a ripe area of research.
|
Conclusion
- The familiar statement “we are what we eat” may be a familiar nutritional concept but the drive to eat what will in turn incorporate to the components of the body is in many ways an unfolding mystery. With higher order neuroendocrine integration, the drive to consume food as a means of energy is weighed against the energetic status and essential need of the body. Obesity is in many ways a disorder of this food-intake and metabolic energy system. Though the origin of overeating may be found elsewhere, the higher order integrative functionality of which PPARγ is an integral part resides in the arcuate nucleus of the hypothalamus. The energy balance of the body is related to intracellular oxidative state as well as inflammatory status; therefore, most of the illness plaguing the Western world is one of energetic imbalance.
References
Primary source research articles
1. Chandra, V.; Huang, P.; Hamuro, Y.; Raghuram, S.; Wang, Y.; Burris, T. P.; Rastinejad, F. (2008): Structure of the intact PPAR-γ--RXR-α nuclear receptor complex on DNA. Nature 456: (7220) 350-356.
2. Diano, S.; Liu, Z.-W.; Jeong, J. K.; Dietrich, M. O.; Ruan, H.-B.; Kim, E.; Suyama, S.; Kelly, K.; Gyengesi, E.; Arbiser, J. L.; Belsham, D. D.; Sarruf, D. A.; Schwartz, M. W.; Bennett, A. M.; Shannabrough, M.; Mobbs, C. V.; Yang, X.; Gao, X.-B.; Horvath, T. L. (2012): Peroxisome proliferation-related ROS control sets melanocortin tone and feeding in diet-induced obesity. Nature Medicine 17: (9) 1121-1127.
3. Drougard, A.; Fournel, A.; Valet, P.; Knauf, C. (2015): Impact of hypothalamic reactive oxygen species in the regulation of energy metabolism and food intake. Frontiers in Neuroscience 9: (56).
4. Garretson, J. T.; Teubner, B. T. W.; Grove, K. L.; Vazdarjanova, A.; Ryu. V.; Bartness, T. J. (2015): Peroxisome Proliferator-Activated Receptor γ Controls Ingestive Behavior, Agouti-Related Protein, and Neuropeptide Y mRNA in the Arcuate Hypothalamus. The Journal of Neuroscience 35: (11) 4571-4581.
5. Lehrke, M.; Lazar, M. (2005): The Many Faces of PPARγ. Cell 123: 993-999.
6. Merchan, B. B.; Tinahones, F. J.; Macias-Gonzalez, M. (2016): Commonalities in the Association between PPARG and Vitamin D Related with Obesity and Carcinogenesis. PPAR Research 2016: Article ID 2308249, 15 pages.
7. Orlov, I.; Rochel, N.; Moras, D.; Klaholz, B. P. (2012): Structure of the full human RXR/VDR nuclear heterodimer complex with its DR3 target DNA. The EMBO Journal 31: 291-300.
8. Sen, S.; Penfield-Cyr, A.; Hollis, B. W.; Wagner, C. L. (2017): Maternal Obesity, 25-Hydroxy Vitamin D Concentration, and Bone Density in Breastfeeding Dyads. The Journal of Pediatrics 187: 147-152.
9. Sisley, S. R.; Arble, D. M.; Chambers, A. P.; Gutierrez-Aguilar, R.; Yanlin, H.; Xu, Y.; Gardner, D.; Moore, D. D.; Seeley, R. J.; Sandoval, D. A. (2016): Hypothalamic Vitamin D Improves Glucose Homeostasis and Reduces Weight. Diabetes 65: 2732-2741.
10. Tyagi, S.; Gupta, P.; Saini, A. S.; Kaushal, C.; Sharma, S. (2015): The peroxisome proliferator-activated receptor: A family of nuclear receptors in various diseases. Journal of Advanced Pharmaceutical Technology & Research 4: (2) 236-240.
11. Varga, T.; Czimmerer, Z.; Nagy, L. (2011): PPARs are a unique set of fatty acid regulated transcription factors controlling both lipid metabolism and inflammation. Biochimica et Biophysica Acta 1812: 1007-1022.
12. Warden, A.; Truitt, J.; Merriman, M.; Ponomareva, O.; Jameson, K.; Ferguson, L. B.; Mayfield, R. D.; Harris, R. A. (2016): Localization of PPAR isotypes in the adult mouse and human brain. Nature Scientific Reports 6: (27618).
Figures
Figure 1: Composite from Allen Institute for Brain Science. Allen Mouse Brain Coronal Reference Atlas version 1 (2008). POMC detail: ISH Data Gene search Atlas, Pomc-RP_Baylor_102974-coronal. AgRP detail: ISH Data Gene search Atlas, Agrp-RP_051027_01_B05-coronal.
Figure 2: Adapted from Broberger et al 2005 Fig.1. Broberger, C. (2005): Brain regulation of food intake and appetite: molecules and networks. Journal of Internal Medicine 258: 301-327.
Figure 3: Wikimedia Commons. Uploaded to PDB with free access. Chandra, V.; Huang, P.; Hamuro, Y.; Raghuram, S.; Wang, Y.; Burris, T. P.; Rastinejad, F. (2008): Structure of the intact PPAR-γ--RXR-α nuclear receptor complex on DNA. Nature 456: (7220) 350-356.
Figure 4: Adapted from Varga et al 2011 Fig. 2. Varga, T.; Czimmerer, Z.; Nagy, L. (2011): PPARs are a unique set of fatty acid regulated transcription factors controlling both lipid metabolism and inflammation. Biochimica et Biophysica Acta 1812: 1007-1022.
Figure 5: Adapted from Merchan et al 2016 Figure 2. Merchan, B. B.; Tinahones, F. J.; Macias-Gonzalez, M. (2016): Commonalities in the association between PPARG and Vitamin D Related with Obesity and Carcinogenesis. PPAR Research 2016: Article ID 2308249, 15 pages.

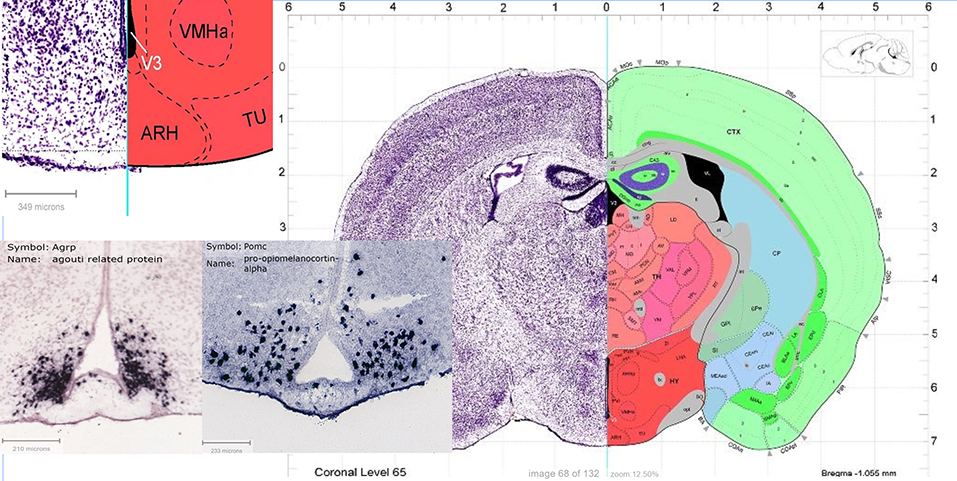 Figure 1. Arcuate Nucleus (ARC/ARH) shown in coronal section from Allen Brain Reference Atlas. Nickel stain shown on half of brain for general contrast. Detail to show hypothalamic arcuate nucleus position (ARH) schematically. Specific AgRP and POMC protein staining shown.
 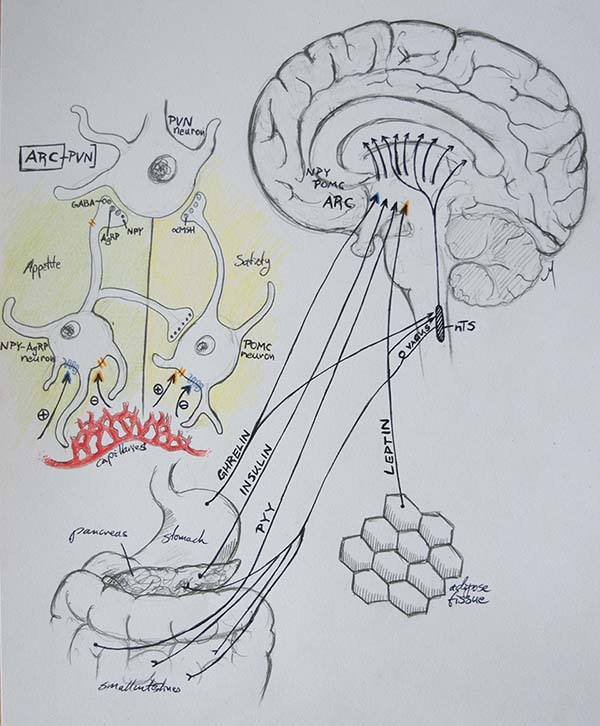 Figure 2. Central metabolic circuitry and ARC neurons in melanocortin system. Detail in color shows detail of ARC connection to PVN. Blue arrow tips show ghrelin positive or negative effect on ARC neurons; orange arrow tips show leptin positive or negative effect on ARC neurons. nTS: nucleus tractus solitarius. PYY: peptide YY.
 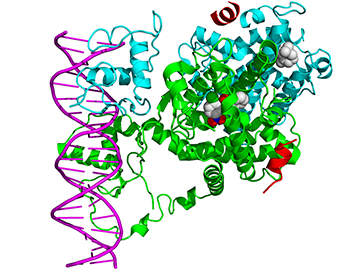 Figure 3. PPAR and RXR structure. PPARγ shown in green, RXRα shown in turquoise blue. Ligands shown in expanded white spherical structures binding internally to PPARγ and RXRα.
 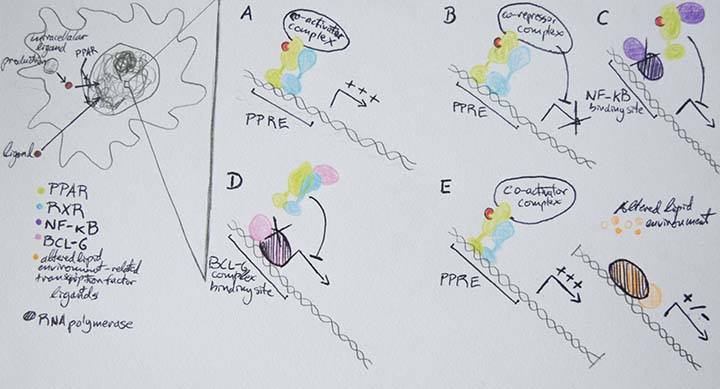 Figure 4. Mechanisms of transcriptional regulation by PPARs. A: direct transactivation. B: direct repression. C: ligand dependent trans-repression; after ligand binding PPAR can interfere with the activity of transcription factors, such as NF-κD. D: ligand independent transrepression; unliganded PPAR can bind and sequester transcription factors, such as BCL-6. E: alteration of lipid homeostasis affecting gene regulation (activation or repression) through unrelated transcription factors.
 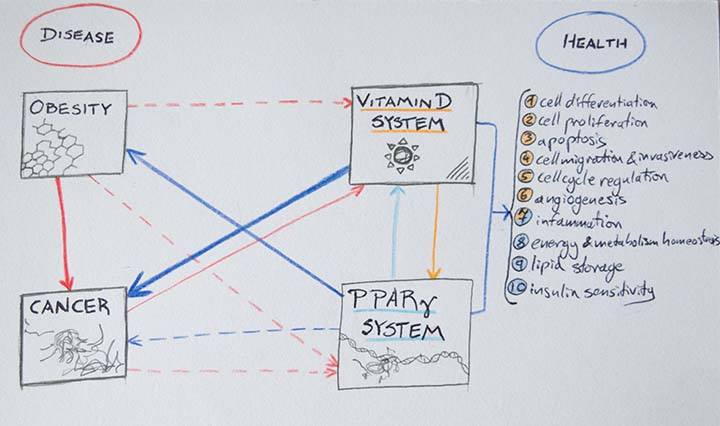 Figure 5. Balance of disease and health in vitamin D/VDR system and PPARγ system crosstalk. Blue arrows: positive effects. Red arrows: harmful effects. Light blue arrow: PPARγ system influence on vitamin D system, orange arrow: vitamin D influence on PPARγ system. Arrow width proportional to strength and consistency of association. Continuous line: in vitro/ in vivo evidence demonstrated effects. Dashed line: hypothetical effects. Orange colored numbers are processes attributed to vitamin D system. Light blue colored numbers are processes attributed to PPARγ system.